
Rebuilding QueryModels from an EventStore
Rebuilding all read-models (projections) from an EventStore can be slow, because we are processing hundreds of thousands of events with several projections. This is one area where having a boost in performance is crucial and it is where I want to understand how much our logging infrastructure impact on performance.
For this scenario I have a small batch of events (~4k) and evlog4net logging level set at DEBUG level; this will generates ~35k log messages in this reference scenario.
Projections are grouped by slots, each slot contains a certain number of projections, and each slots processes events in a separate thread (the exact architecture will be subject of future post)
First run
Here is what happened during the first run.
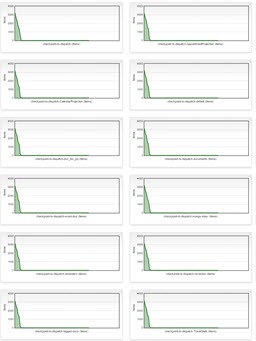
This is a low resolution image, but it represents how much time the system needs to rebuild all projections with no log enabled. The Y-Axis represents how many events remain to dispatch for each slot (each graph is one slot), X-Axis represents time..
This is the reference scenario, now logging is enabled at DEBUG level, both for our MongoBufferedAppender and for ColoredConsoleAppender.
What happens with all logs enabled
The situation really changed a lot:
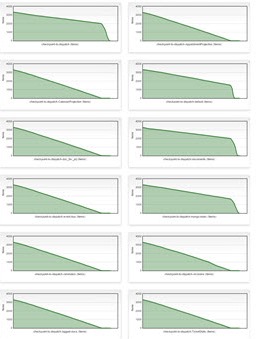
Even if you have no X-Axis legend, it is really evident that the whole process is slowed down a lot having log enabled.
We do not need exact measurement, even if the image is a low resolution one and we have no legend on X-Axis it is evident that: Enabling logging is slowing down everything.
We have also a really strange behaviour: most of the projections consumes events lineraly, three slots are really slower (this is normal), but when the other slots finished rebuild, the three slow slots speed up considerably. This means that Logging infrastructure is somewhat bounding toghether performances of different slots.
Believe it or not, the reason is, ColoredConsoleAppender. We have multiple services running in Console applications with TopShelf; they can run as a service in production environment, but we use console appender to have a visual clue of what is happening during development/debug, when services are run as standard console applications.
Stopping ColoredConsoleAppender
The next run is done simply setting threshold level of ColoredConsoleAppender to INFO instead of DEBUG. this reduce number of logs to ~500 for the entire run. Here is the result.
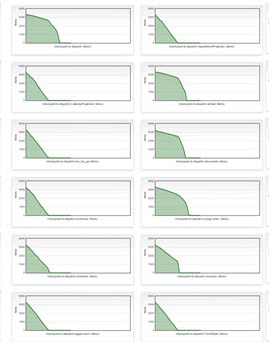
The whole rebuild is really faster. It is still slower that having no log enabled but we have a real better scenario. Again, you do not need exact measurement, the impact of disabling ColoredConsoleAppender is so great that it is evident that Logging to console has a huge impact on performances.
Actually I never liked too much console appender in log4net for various reason.
- It slows down your application
- It is difficult to read logs, console app have a limited buffer space and logs disappear quickly.
- Log disappear when the program is closed
- You have no way to query log, you only have a huge sequence of text scrolling on a console app
- If the program crashes usually you see a red log with the exception and the console app immediately closes befoure you can read what happened.
All these consideration lead to an obvious conclusion: Console Appender is not useful, the only purpose is showing you that the program is doing something and it is not blocked somewhere.
If you want to use logging infrastructure to have an idea of progress of your application, please convince yourself that this is not a good idea. Using logs to verify that the application is doing something has little utility and it is not the reason logs are built for.
Now it is time to the final run.
Using MongoDbAppender with writer on a dedicated thread and LooseFix
We can further improve performance if you know how log4net works internally. Our MongoDbAppender inherits from BufferingAppenderSkeleton and you can read on my english blog why it slows down performances: BufferingAppenderSkeleton performance problem.
Armed with this knowledge I’ve done a final run using LooseFix and asking mongo appender to use a dedicated thread to save logs and here is the result.
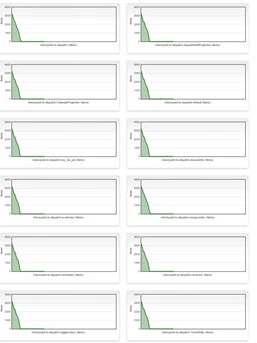
Even if the image is small, you can verify that this image is quite similar to the first one. This is the desired situation, logging infrastructure cannot be completely transparent in performances, but if the loss in performance is negligible, the advantage of logging lots of information is invaluable.
MongoDbAppender have several advantages over ColoredConsoleAppender
- It is durable; logs are maintained after the application is closed
- You can query to find logs with lots of conditions (even regular expression)
- You can setup a simple process to move logs from various Mongo source to a single location (Ex Elasticsearch + Kibana)
- If you poll log collection and read most recent 10 logs and total count you can have idea of progress (this is not a perfect solution, but at least you can use for this purpose if you want).
What we learned
This example give us some guidelines on how to handle log in production:
Logging is useful and the more information you log, the easier is to find a problem. The golden rule is: measure performance penalties in production, use only a single appender to persists logs in a durable medium that allow searching and you are ready to go.
Gian Maria.